7.7 Pytorch实现词性判别
我们知道每一个词都有词性,如train这个单词,可表示火车或训练等意思,具体表示为哪种词性,跟这个词所处的环境或上下文密切相关。要根据上下文来确定词性,正是循环网络擅长的事,因循环网络,尤其是LSTM或GRU网络,具有记忆功能。
这节将使用LSTM网络实现词性判别。
7.7.1 词性判别主要步骤
如何用LSTM对一句话里的各词进行词性标注?需要采用哪些步骤?这些问题就是这节将涉及的问题。用LSTM实现词性标注,我们可以采用以下步骤:
(1)实现词的向量化
假设有两个句子,作为训练数据,这两个句子的每个单词都已标好词性。当然我们不能直接把这两个语句直接输入LSTM模型,输入前需要把每个语句的单词向量化。假设这个句子共有5个单词,通过单词向量化后,就可得到序列[V_1, V_2, V_3, V_4, V_5],其中V_i表示第i个单词对应的向量。如何实现词的向量化?我们可以直接利用nn.Embedding层即可。当然在使用该层之前,需要把每句话对应单词或词性用整数表示。
(2)构建网络
词向量化之后,需要构建一个网络来训练,可以构建一个只有三层的网络,第一层为词嵌入层,第二层为LSTM层,最后一层用于词性分类的全连接层。
以下用Pytorch实现这些步骤。
7.7.2 数据预处理
(1)定义语句及词性
训练数据有两个语句,定义好每个词对应的词性。测试数据为一句话,没有指定词性。
|
1 2 3 4 5 6 7 |
#定义训练数据 training_data = [ ("The cat ate the fish".split(), ["DET", "NN", "V", "DET", "NN"]), ("They read that book".split(), ["NN", "V", "DET", "NN"]) ] #定义测试数据 testing_data=[("They ate the fish".split())] |
(2)构建每个单词的索引字典
把每个单词用一个整数表示,将它们放在一个字典里。词性也如此。
|
1 2 3 4 5 6 7 8 |
word_to_ix = {} # 单词的索引字典 for sent, tags in training_data: for word in sent: if word not in word_to_ix: word_to_ix[word] = len(word_to_ix) print(word_to_ix) #两句话,共有9个不同单词 #{'The': 0, 'cat': 1, 'ate': 2, 'the': 3, 'fish': 4, 'They': 5, 'read': 6, 'that': 7, 'book': 8} |
手工设置词性的索引字典。
tag_to_ix = {"DET": 0, "NN": 1, "V": 2}
7.7.3 构建网络
构建训练网络,共三层,分别为嵌入层、LSTM层、全连接层。
|
1 2 3 4 5 6 7 8 9 10 11 12 13 14 15 16 17 18 19 20 21 22 23 24 25 26 27 28 |
class LSTMTagger(nn.Module): def __init__(self, embedding_dim, hidden_dim, vocab_size, tagset_size): super(LSTMTagger, self).__init__() self.hidden_dim = hidden_dim self.word_embeddings = nn.Embedding(vocab_size, embedding_dim) self.lstm = nn.LSTM(embedding_dim, hidden_dim) self.hidden2tag = nn.Linear(hidden_dim, tagset_size) self.hidden = self.init_hidden() #初始化隐含状态State及C def init_hidden(self): return (torch.zeros(1, 1, self.hidden_dim), torch.zeros(1, 1, self.hidden_dim)) def forward(self, sentence): #获得词嵌入矩阵embeds embeds = self.word_embeddings(sentence) #按lstm格式,修改embeds的形状 lstm_out, self.hidden = self.lstm(embeds.view(len(sentence), 1, -1), self.hidden) #修改隐含状态的形状,作为全连接层的输入 tag_space = self.hidden2tag(lstm_out.view(len(sentence), -1)) #计算每个单词属于各词性的概率 tag_scores = F.log_softmax(tag_space,dim=1) return tag_scores |
其中有一个nn.Embedding(vocab_size, embed_dim)类,它是Module类的子类,这里它接受最重要的两个初始化参数:词汇量大小,每个词汇向量表示的向量维度。Embedding类返回的是一个形状为[每句词个数,词维度]的矩阵。nn.LSTM层的输入形状为(序列长度,批量大小,输入的大小),序列长度就是时间步序列长度,这个长度是可变的。F.log_softmax()执行的是一个Softmax回归的对数。
把数据转换为模型要求的格式,即把输入数据需要转换为torch.LongTensor张量。
|
1 2 3 4 |
def prepare_sequence(seq, to_ix): idxs = [to_ix[w] for w in seq] tensor = torch.LongTensor(idxs) return tensor |
7.7.4 训练网络
(1)定义几个超参数、实例化模型,选择损失函数、优化器等
|
1 2 3 4 5 |
EMBEDDING_DIM=10 HIDDEN_DIM=3 #这里等于词性个数 model = LSTMTagger(EMBEDDING_DIM, HIDDEN_DIM, len(word_to_ix), len(tag_to_ix)) loss_function = nn.NLLLoss() optimizer = torch.optim.SGD(model.parameters(), lr=0.1) |
(2)简单运行一次
|
1 2 3 4 5 6 7 8 9 10 |
model = LSTMTagger(EMBEDDING_DIM, HIDDEN_DIM, len(word_to_ix), len(tag_to_ix)) loss_function = nn.NLLLoss() optimizer = torch.optim.SGD(model.parameters(), lr=0.1) inputs = prepare_sequence(training_data[0][0], word_to_ix) tag_scores = model(inputs) print(training_data[0][0]) print(inputs) print(tag_scores) print(torch.max(tag_scores,1)) |
['The', 'cat', 'ate', 'the', 'fish']
tensor([0, 1, 2, 3, 4])
tensor([[-1.4376, -0.9836, -0.9453],
[-1.4421, -0.9714, -0.9545],
[-1.4725, -0.8993, -1.0112],
[-1.4655, -0.9178, -0.9953],
[-1.4631, -0.9221, -0.9921]], grad_fn=)
(tensor([-0.9453, -0.9545, -0.8993, -0.9178, -0.9221], grad_fn=),
tensor([2, 2, 1, 1, 1]))
显然,这个结果不很理想。而下面我们循环多次训练该模型,精度将大大提升。
(3)训练模型
|
1 2 3 4 5 6 7 8 9 10 11 12 13 14 15 16 17 18 19 20 21 |
for epoch in range(400): # 我们要训练400次。 for sentence, tags in training_data: # 清除网络先前的梯度值 model.zero_grad() # 重新初始化隐藏层数据 model.hidden = model.init_hidden() # 按网络要求的格式处理输入数据和真实标签数据 sentence_in = prepare_sequence(sentence, word_to_ix) targets = prepare_sequence(tags, tag_to_ix) # 实例化模型 tag_scores = model(sentence_in) # 计算损失,反向传递梯度及更新模型参数 loss = loss_function(tag_scores, targets) loss.backward() optimizer.step() # 查看模型训练的结果 inputs = prepare_sequence(training_data[0][0], word_to_ix) tag_scores = model(inputs) print(training_data[0][0]) print(tag_scores) print(torch.max(tag_scores,1)) |
['The', 'cat', 'ate', 'the', 'fish']
tensor([[-4.9405e-02, -6.8691e+00, -3.0541e+00],
[-9.7177e+00, -7.2770e-03, -4.9350e+00],
[-3.0174e+00, -4.4508e+00, -6.2511e-02],
[-1.6383e-02, -1.0208e+01, -4.1219e+00],
[-9.7806e+00, -8.2493e-04, -7.1716e+00]], grad_fn=)
(tensor([-0.0494, -0.0073, -0.0625, -0.0164, -0.0008], grad_fn=),
tensor([0, 1, 2, 0, 1]))
这个精度为100%
7.7.5 测试模型
这里我们用另一句话,来测试这个模型
|
1 2 3 4 5 6 |
test_inputs = prepare_sequence(testing_data[0], word_to_ix) tag_scores01 = model(test_inputs) print(testing_data[0]) print(test_inputs) print(tag_scores01) print(torch.max(tag_scores01,1)) |
['They', 'ate', 'the', 'fish']
tensor([5, 2, 3, 4])
tensor([[-7.6594e+00, -5.2700e-03, -5.3424e+00],
[-2.6831e+00, -5.2537e+00, -7.6429e-02],
[-1.4973e-02, -1.0440e+01, -4.2110e+00],
[-9.7853e+00, -8.3971e-04, -7.1522e+00]], grad_fn=)
(tensor([-0.0053, -0.0764, -0.0150, -0.0008], grad_fn=),
tensor([1, 2, 0, 1]))
测试精度达到100%
7.8 用LSTM预测股票行情
这里采用沪深300指数数据,时间跨度为2010-10-10至今,选择每天最高价格。假设当天最高价依赖当天的前n(如30)天的沪深300的最高价。用LSTM模型来捕捉最高价的时序信息,通过训练模型,使之学会用前n天的最高价,判断当天的最高价(作为训练的标签值)。
7.8.1 导入数据
这里使用tushare来下载沪深300指数数据。可以用pip 安装tushare。
|
1 2 3 4 5 6 7 8 9 |
import tushare as ts #导入 cons = ts.get_apis() #建立连接 #获取沪深指数(000300)的信息,包括交易日期(datetime)、开盘价(open)、收盘价(close), #最高价(high)、最低价(low)、成交量(vol)、成交金额(amount)、涨跌幅(p_change) df = ts.bar('000300', conn=cons, asset='INDEX', start_date='2010-01-01', end_date='') #删除有null值的行 df = df.dropna() #把df保存到当前目录下的sh300.csv文件中,以便后续使用 df.to_csv('sh300.csv') |
7.8.2 数据概览
(1)查看下载数据的字段、统计信息等。
|
1 2 3 4 5 6 |
#查看df涉及的列名 df.columns # Index(['code', 'open', 'close', 'high', 'low', 'vol', 'amount', 'p_change'], #dtype='object') #查看df的统计信息 df.describe() |
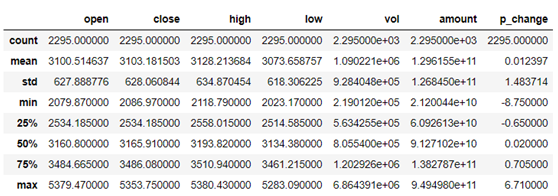
图7-15 沪深300指数统计信息
从图7-15可知,共有2295条数据。
(2)可视化最高价数据
|
1 2 3 4 5 6 7 8 9 |
from pandas.plotting import register_matplotlib_converters register_matplotlib_converters() # 获取训练数据、原始数据、索引等信息 df, df_all, df_index = readData('high', n=n, train_end=train_end) #可视化最高价 df_all = np.array(df_all.tolist()) plt.plot(df_index, df_all, label='real-data') plt.legend(loc='upper right') |
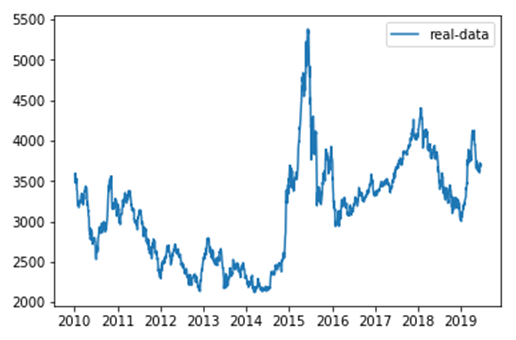
图7-16 可视化最高价
7.8.3 预处理数据
(1)生成训练数据
|
1 2 3 4 5 6 7 8 9 10 11 12 13 14 15 16 17 18 19 20 21 22 23 24 25 26 27 28 |
#通过一个序列来生成一个31*(count(*)-train_end)矩阵(用于处理时序的数据) #其中最后一列维标签数据。就是把当天的前n天作为参数,当天的数据作为label def generate_data_by_n_days(series, n, index=False): if len(series) <= n: raise Exception("The Length of series is %d, while affect by (n=%d)." % (len(series), n)) df = pd.DataFrame() for i in range(n): df['c%d' % i] = series.tolist()[i:-(n - i)] df['y'] = series.tolist()[n:] if index: df.index = series.index[n:] return df #参数n与上相同。train_end表示的是后面多少个数据作为测试集。 def readData(column='high', n=30, all_too=True, index=False, train_end=-500): df = pd.read_csv("sh300.csv", index_col=0) #以日期为索引 df.index = list(map(lambda x: datetime.datetime.strptime(x, "%Y-%m-%d"), df.index)) #获取每天的最高价 df_column = df[column].copy() #拆分为训练集和测试集 df_column_train, df_column_test = df_column[:train_end], df_column[train_end - n:] #生成训练数据 df_generate_train = generate_data_by_n_days(df_column_train, n, index=index) if all_too: return df_generate_train, df_column, df.index.tolist() return df_generate_train |
(2)规范化数据
#对数据进行预处理,规范化及转换为Tensor
df_numpy = np.array(df)
df_numpy_mean = np.mean(df_numpy)
df_numpy_std = np.std(df_numpy)
df_numpy = (df_numpy - df_numpy_mean) / df_numpy_std
df_tensor = torch.Tensor(df_numpy)
trainset = mytrainset(df_tensor)
trainloader = DataLoader(trainset, batch_size=batch_size, shuffle=False)
7.8.4 定义模型
这里使用LSTM网络,LSTM输出到一个全连接层。
|
1 2 3 4 5 6 7 8 9 10 11 12 13 14 15 16 |
class RNN(nn.Module): def __init__(self, input_size): super(RNN, self).__init__() self.rnn = nn.LSTM( input_size=input_size, hidden_size=64, num_layers=1, batch_first=True ) self.out = nn.Sequential( nn.Linear(64, 1) ) def forward(self, x): r_out, (h_n, h_c) = self.rnn(x, None) #None即隐层状态用0初始化 out = self.out(r_out) return out |
7.8.5 训练模型
|
1 2 3 4 5 6 7 8 9 10 11 12 13 14 15 16 17 18 19 |
#记录损失值,并用tensorboardx在web上展示 from tensorboardX import SummaryWriter writer = SummaryWriter(log_dir='logs') rnn = RNN(n).to(device) optimizer = torch.optim.Adam(rnn.parameters(), lr=LR) loss_func = nn.MSELoss() for step in range(EPOCH): for tx, ty in trainloader: tx=tx.to(device) ty=ty.to(device) #在第1个维度上添加一个维度为1的维度,形状变为[batch,seq_len,input_size] output = rnn(torch.unsqueeze(tx, dim=1)).to(device) loss = loss_func(torch.squeeze(output), ty) optimizer.zero_grad() loss.backward() optimizer.step() writer.add_scalar('sh300_loss', loss, step) |
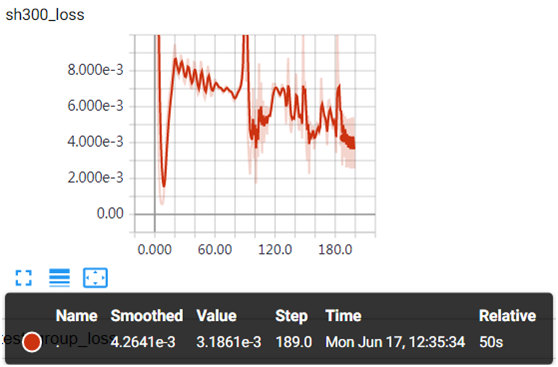
图7-17 batch-size=20的损失值变化情况
图7-17为batch-size=20时,损失值与迭代次数之间的关系,开始时振幅有点大,后面逐渐趋于平稳。如果batch-size变小,振幅可能更大。
7.8.6 测试模型
(1)使用测试数据,验证模型
|
1 2 3 4 5 6 7 8 9 10 |
for i in range(n, len(df_all)): x = df_all_normal_tensor[i - n:i].to(device) #rnn的输入必须是3维,故需添加两个1维的维度,最后成为[1,1,input_size] x = torch.unsqueeze(torch.unsqueeze(x, dim=0), dim=0) y = rnn(x).to(device) if i < test_index: generate_data_train.append(torch.squeeze(y).detach().cpu().numpy() * df_numpy_std + df_numpy_mean) else: generate_data_test.append(torch.squeeze(y).detach().cpu().numpy() * df_numpy_std + df_numpy_mean) |
(2)查看预测数据与源数据
|
1 2 3 4 |
plt.plot(df_index[train_end:-500], df_all[train_end:-500], label='real-data') plt.plot(df_index[train_end:-500], generate_data_test[-600:-500], label='generate_test') plt.legend() plt.show() |
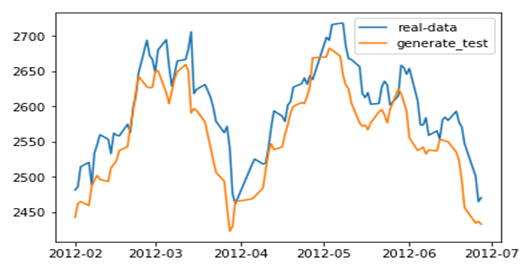
图7-18 放大后预测数据与源数据比较
从图7-18 来看,预测结果还是不错的。
